Saturday, April 19, 2014

Obtaining Memory Sizing Advice for ASMM

The following steps describe how to obtain memory sizing advice when automatic shared memory management (ASMM) is enabled.
To obtain memory sizing advice for ASMM:

  1. Go to the Database Home page.
    See "Accessing the Database Home Page".
  2. At the bottom of the page, click Advisor Central.
  3. On the Advisor Central page, click Memory Advisors.
    The Memory Advisors page appears.
  4. On the SGA subpage, next to the Total SGA Size field, click Advice.

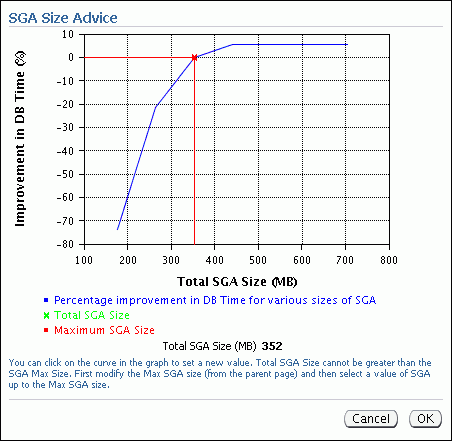
    The SGA Size Advice child page appears in a separate window.
    Description of sga-sizeadvice.gif follows
    Description of the illustration sga-sizeadvice.gif

    Improvement in DB Time (%) is plotted against Total SGA size. A higher number for Improvement in DB Time is better for performance. In this sample figure, the graph indicates that increasing the SGA size greater than 450 MB results in no performance gain. Thus, 450 MB is the recommended optimal SGA size.
    Click OK to close the SGA Size Advice child page.
  5. Near the top of the Memory Advisors page, click PGA to display the PGA subpage.
  6. Next to Aggregate PGA Target, click Advice.
    The PGA Target Advice page appears, plotting cache hit percentage against PGA target size.
    The cache hit percentage is the percentage of read requests serviced by memory, as opposed to those requests serviced by reading from disk, which is slower. A higher hit percentage indicates better cache performance. The optimal zone for cache hit percentage is between 75 and 100 percent. However, it is not safe to conclude that your database is having performance problems simply because your cache hit percentage is not within the optimal zone. When the amount of currently available PGA memory is not adequate for optimal performance, ADDM automatically recommends adjusting this value in a performance finding.

Thursday, April 17, 2014

Automatic Tuning of Undo Retention and Optimization

Oracle Database automatically tunes the undo retention period based on how the undo tablespace is configured.
If the undo tablespace is fixed size, the database tunes the retention period for the best possible undo retention for that tablespace size and the current system load. This tuned retention period can be significantly greater than the specified minimum retention period.
If the undo tablespace is configured with the AUTOEXTEND option, the database tunes the undo retention period to be somewhat longer than the longest-running query on the system at that time. Again, this tuned retention period can be greater than the specified minimum retention period.
Determine the current retention period by querying the TUNED_UNDORETENTION column of the V$UNDOSTAT view. This view contains one row for each 10-minute statistics collection interval over the last 4 days. (Beyond 4 days, the data is available in the DBA_HIST_UNDOSTAT view.) TUNED_UNDORETENTION is given in seconds.
select to_char(begin_time, 'DD-MON-RR HH24:MI') begin_time,
 to_char(end_time, 'DD-MON-RR HH24:MI') end_time, tuned_undoretention
 from v$undostat order by end_time;
BEGIN_TIME END_TIME TUNED_UNDORETENTION
 --------------- --------------- -------------------
 04-FEB-05 00:01 04-FEB-05 00:11 12100
 ...
 07-FEB-05 23:21 07-FEB-05 23:31 86700
 07-FEB-05 23:31 07-FEB-05 23:41 86700
 07-FEB-05 23:41 07-FEB-05 23:51 86700
 07-FEB-05 23:51 07-FEB-05 23:52 86700
576 rows selected.
Calculating UNDO_RETENTION for given UNDO Tabespace
The following query will helps to optimize the UNDO_RETENTION parameter:
Otimal Undo Retention


Because these following queries use the V$UNDOSTAT statistics, run the queries only after the database has been running with UNDO for a significant and representative time!
Actual Undo Size
SELECT SUM(a.bytes) "UNDO_SIZE"
 FROM v$datafile a,
 v$tablespace b,
 dba_tablespaces c
 WHERE c.contents = 'UNDO'
 AND c.status = 'ONLINE'
 AND b.name = c.tablespace_name
 AND a.ts# = b.ts#;
UNDO_SIZE
----------
 1572864000
Undo Blocks per Second
SELECT MAX(undoblks/((end_time-begin_time)*3600*24))
 "UNDO_BLOCK_PER_SEC"
 FROM v$undostat;
UNDO_BLOCK_PER_SEC
------------------
 249.398333333333333333333333333333333333
DB Block Size
SELECT TO_NUMBER(value) "DB_BLOCK_SIZE [KByte]"
 FROM v$parameter
WHERE name = 'db_block_size';
DB_BLOCK_SIZE [Byte]
--------------------
 8192
Optimal Undo Retention
770 [Sec]
Using Inline Views:
SELECT d.undo_size/(1024*1024) "ACTUAL UNDO SIZE [MByte]",
 SUBSTR(e.value,1,25) "UNDO RETENTION [Sec]",
 ROUND((d.undo_size / (to_number(f.value) *
 g.undo_block_per_sec))) "OPTIMAL UNDO RETENTION [Sec]"
 FROM (
 SELECT SUM(a.bytes) undo_size
 FROM v$datafile a,
 v$tablespace b,
 dba_tablespaces c
 WHERE c.contents = 'UNDO'
 AND c.status = 'ONLINE'
 AND b.name = c.tablespace_name
 AND a.ts# = b.ts#
 ) d,
 v$parameter e,
 v$parameter f,
 (
 SELECT MAX(undoblks/((end_time-begin_time)*3600*24))
 undo_block_per_sec
 FROM v$undostat
 ) g
WHERE e.name = 'undo_retention'
 AND f.name = 'db_block_size'
/
ACTUAL UNDO SIZE [MByte]
------------------------
1500
UNDO RETENTION [Sec]
--------------------
900
OPTIMAL UNDO RETENTION [Sec]
----------------------------
770
Calculating required UNDO Size for given Database Activity
If you are not limited by disk space, then it would be better to choose the UNDO_RETENTION time that is best for you (for FLASHBACK, etc.). Allocate the appropriate size to the UNDO tablespace according to the database activity:
Again, all in one query:
SELECT d.undo_size/(1024*1024) "ACTUAL UNDO SIZE [MByte]",
 SUBSTR(e.value,1,25) "UNDO RETENTION [Sec]",
 (TO_NUMBER(e.value) * TO_NUMBER(f.value) *
 g.undo_block_per_sec) / (1024*1024) 
 "NEEDED UNDO SIZE [MByte]"
 FROM (
 SELECT SUM(a.bytes) undo_size
 FROM v$datafile a,
 v$tablespace b,
 dba_tablespaces c
 WHERE c.contents = 'UNDO'
 AND c.status = 'ONLINE'
 AND b.name = c.tablespace_name
 AND a.ts# = b.ts#
 ) d,
 v$parameter e,
 v$parameter f,
 (
 SELECT MAX(undoblks/((end_time-begin_time)*3600*24))
 undo_block_per_sec
 FROM v$undostat
 ) g
 WHERE e.name = 'undo_retention'
 AND f.name = 'db_block_size'
/

ACTUAL UNDO SIZE [MByte]
------------------------
1500
UNDO RETENTION [Sec] 
--------------------
900
NEEDED UNDO SIZE [MByte]
------------------------
1753.582031249999999999999999999999999998
The previous query may return a “NEEDED UNDO SIZE” that is less than the “ACTUAL UNDO SIZE”. If this is the case, you may be wasting space. You can choose to resize your UNDO tablespace to a lesser value or increase your UNDO_RETENTION parameter to use the additional space.
References / Source:
Wednesday, April 16, 2014

Fatal NI connect error 12514, connecting to:

We have a script to monitor the alert.log file for any ORA-xxxx errors.
With 11g we found out many entries in regards of:
Fatal NI connect error
The problem:
alert.log file has many entries for Fatal NI connect error.
Examples:
1
2
3
4
5
6
7
8
9
10
11
12
13
14
15
16
17
18
19
20
21
22
23
***********************************************************************
 
Fatal NI connect error 12514, connecting to:
 (DESCRIPTION=(ADDRESS=(PROTOCOL=TCP)(HOST=xxxx)(PORT=nnn))(CONNECT_DATA=(SERVER=DEDICATED)(SERVICE_NAME=sss)(CID=(PROGRAM=oracle)(HOST=xxx)(USER=oracle))))
 
 VERSION INFORMATION:
 TNS for Linux: Version 11.2.0.2.0 - Production
 TCP/IP NT Protocol Adapter for Linux: Version 11.2.0.2.0 - Production
 Time: 17-JAN-2011 10:20:45
 Tracing not turned on.
 Tns error struct:
 ns main err code: 12564
 
TNS-12564: TNS:connection refused
 ns secondary err code: 0
 nt main err code: 0
 nt secondary err code: 0
 nt OS err code: 0
Error 12514 received logging on to the standby
Mon Jan 17 10:21:45 2011
 
 
***********************************************************************
or
1
2
3
4
5
6
7
8
9
10
11
12
13
14
15
16
17
18
19
20
21
22
***********************************************************************
 
Fatal NI connect error 12170.
 
 VERSION INFORMATION:
 TNS for Linux: Version 11.2.0.2.0 - Production
 Oracle Bequeath NT Protocol Adapter for Linux: Version 11.2.0.2.0 - Production
 TCP/IP NT Protocol Adapter for Linux: Version 11.2.0.2.0 - Production
 Time: 18-JAN-2011 15:13:08
 Tracing not turned on.
 Tns error struct:
 ns main err code: 12535
 
TNS-12535: TNS:operation timed out
 ns secondary err code: 12560
 nt main err code: 505
 
TNS-00505: Operation timed out
 nt secondary err code: 110
 nt OS err code: 0
 Client address: (ADDRESS=(PROTOCOL=tcp)(HOST=<span class="skimlinks-unlinked">xx.xx.x.xx)(PORT=nnnn</span>))
Tue Jan 18 15:40:20 2011
The solution:
We will have an entry on the alert.log file every time a client connection of any kind fails to complete or is aborted.
One way to minimize the impact is by using the parameter SQLNET.INBOUND_CONNECT_TIMEOUT (default to 60 seconds on 10gR2 and 11g) but, sometimes, this value is not adequate.
Oracle also mentions the occurrence of this error if you use DB Console or Enterprise Manager to monitor your databases and the emagent will try to connect to the target database repeatedly and, statistically, some will fail (frequency will depend on how busy your system is).
Most of the time (certainly for DB Console and Enterprise Manager Agent) the application will try to connect again and it will succeed.
To fix the problem you could increase the value of SQLNET.INBOUND_CONNECT_TIMEOUT on the listener.ora and the sqlnet.orafile located on the server side.
If you already have a value you have considered adequate, you might want to add the following line on your listener.ora file:
DIAG_ADR_ENABLED_listener_name=OFF
This line will hide the error on the alert.log file and the error will be posted on the $ORACLE_HOME/network/log/sqlnet.log file